

Meter Readings is a useful application that makes it easy to monitor your household utility meters. Once you start entering readings, your usage, costs and savings are calculated and displayed in easy to visualise graphs.
If you are new to the app, the Getting Started section will give you a quick overview.
There are sections covering the five main application screens: Meter Settings and Rates, Usage, Costs and Graphs, Adding Readings, Readings and Bills and Settings. Plus more detailed sections on Importing Readings, Exporting Readings and Backups.
For support, PLEASE DO NOT use the App Store as reviews are left anonymously and I have no easy way of contacting you if I have questions. Start off with my support page, where known issues and any workarounds are posted as soon as I find out about them. Or contact me directly and you will get a very quick response!
Getting Started


When you first start the application, three default meters are created for you: Electricity, Gas and Water. Decide which you want to track, remove those you don’t want and add any additional meters (e.g. for a second property). This is all done from the meter settings and rates screen (accessed by tapping the arrows icon, top left).
Configure your meters, for example the energy type (e.g. Electricity, Gas, Water, Solar … etc) and the number of digits you have to enter before and after the decimal point. Also set up your current rates (for which a recent bill might be helpful). Again this is done from the meter settings and rates screen.
Add some readings. You might want to start off adding historical readings from your bills, as the more data the application has to work with, the more useful it will be. Then you can add readings as often as you like (personally I do this weekly).
Finally view your usage and costs, and start monitoring your consumption. Hopefully just by doing this you will save money!
Meters
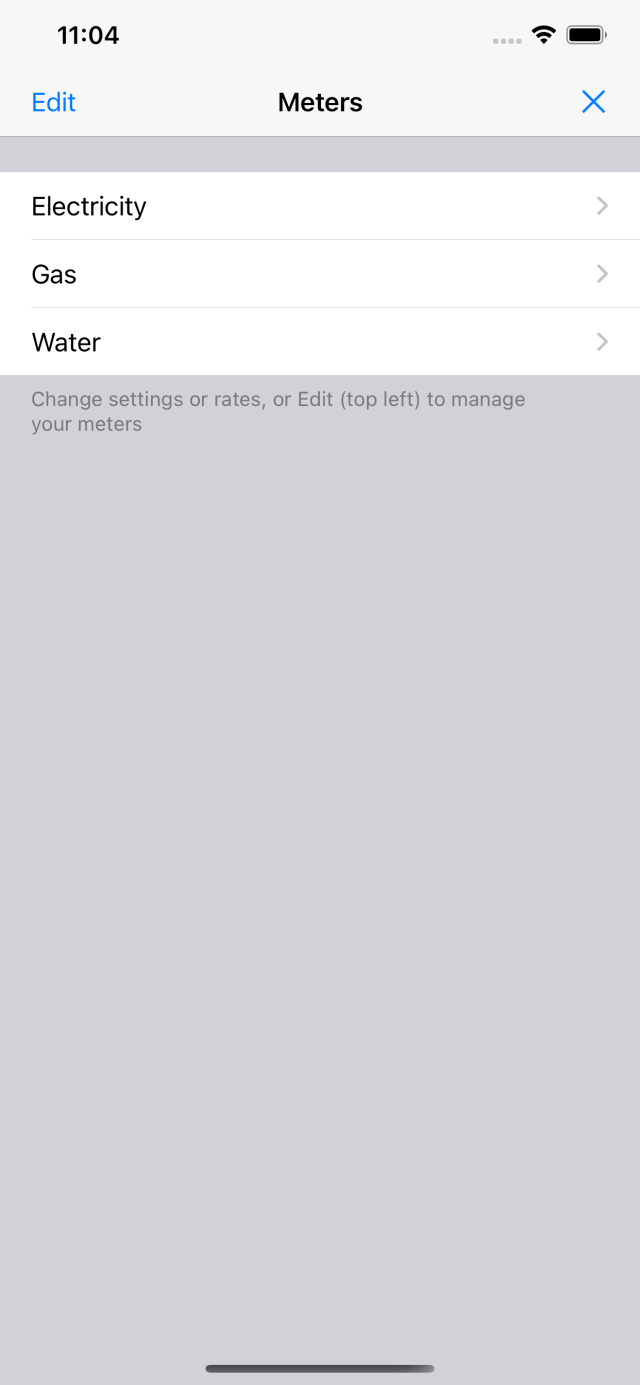
Use the arrows icon at the top left of the main screen, then select Edit to configure your meter settings and rates.
To add, remove or re-order your meters, select All Meters (top left) then Edit. To add a meter, select the green + (plus) button or the row itself, giving it a short name. To remove a meter select the red – (minus) button then confirm with Delete. To re-order your meters select and hold the icon to its right to drag it into the required position. Select Done when finished.
While editing, select a meter to change its settings or rates.
Select Done when finished.
Settings and Rates
Setting up your meters and rates is probably the most complicated thing about the whole application, especially as there are so many different ways energy suppliers and countries do this. If this section doesn’t help you, or if you think the app just can’t support your particular set of rates, please get in touch and I will do my best to help.
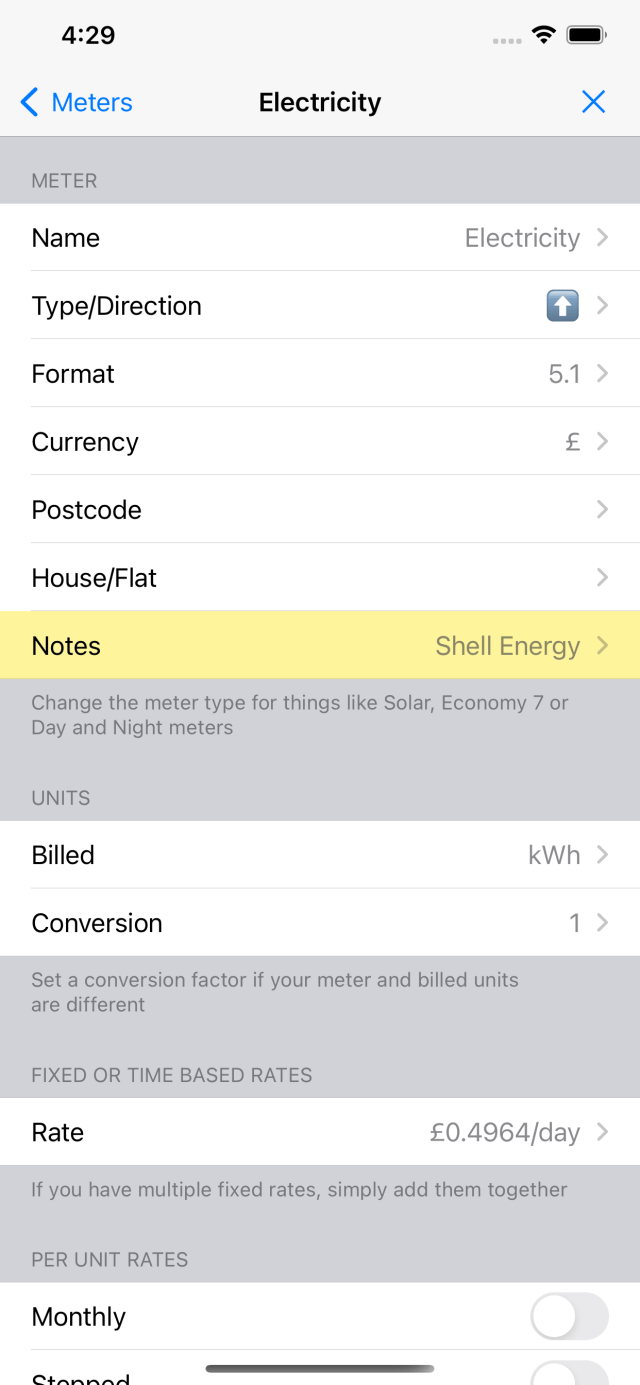
In the first section, set the name and type of your meter (Electricity, Gas, Water, Solar … etc) and the number of readings you submit to your supplier, typically 1 for an all day rate, or 2 for day and night meter like Economy 7 or Economy 10. Some suppliers require 3 sets of readings.
The meter direction lets you use the app for meters that count down (e.g. oil) and meters where your readings are/equals your usage (e.g. broadband data, rainfall … etc). The average type is useful where your readings don’t accumulate (e.g. temperature, height or weight). On the graphs the number of readings in a given period are averaged.
The meter format is how many digits there are before and after the decimal point.
Currency will default to the region setting on your device, however if your meter is abroad (e.g. a holiday home), you can change this here.
If you are based in the UK, set the postcode for your meter, and if you have multiple properties at the same postcode, you can also enter your house or flat number to distinguish between each one.
Notes is a free form text field that lets you store things like your supplier and tariff … etc.
Units refer to how you are billed, i.e. the unit of charging on your bill (typically kWh). For most meters, the billed units are the same as the meter units, so the conversion factor should be left as 1. However for gas, the billed units and meter units are often different. The conversion factor can be quite complex, involving calorific values, volume corrections and divisions, however the end result is a single number. It is easy to calculate this from your bill by dividing the number of kWhs you have been charged for by the units used on your actual meter (i.e. billed units / meter units). This should be approximately 11 for metric meters or 32 for imperial. Note that the calorific value can change between bills (in practice it changes daily!), but this is often by a very small amount so just ignore it.
Fixed (or time based) rates are typically an amount per day, week, month, quarter or year. If you have multiple fixed rates, simply add them together. If you do not have a fixed rate, leave this as 0.
For each of your readings, set the per unit rates. First of all select whether your rate is different per month, and whether is stepped, i.e. changes depending on usage. There are four options …
- If you are charged a single rate for all units, set monthly and stepped to OFF, then enter the rate you are charged
- If you are charged different amounts depending on your usage, set monthly to OFF and stepped to ON. Enter the amount you are charged per unit, the number of units this applies to and over what period, for each of your stepped rates. If the rate applies to all (remaining) units, leave it as 0.
- If you are charged a single rate for all units, but this rate varies by calendar month (or season), set monthly to ON and stepped to OFF. Enter the rate you are charged for each of the twelve months (some may be the same of course).
- If you are charged different rates for initial and remaining units, but the number of initial units varies by calendar month (npower in the UK have rates like this), set monthly and stepped to ON. Enter the initial rate you are charged per unit, the number of units this applies to for each of the twelve months, and the rate you are charged for all remaining units.
Finally set any discounts and your tax rate. Discounts can include both a fixed amount per set period (day, week, month … etc), as well as a percentage discount. The tax rate can be used if you prefer not to include tax in your rates.
Rate Changes
If your rates change, select the “Add rate change” row to copy your current rates into the previous rates section (Power User upgrade required). From here you can edit the date to which your old rates apply, then edit your current settings (as described above) to reflect your new rates.
If you accidently add a rate change, just select the “Rates to” row, then the delete button at the top right of the screen.
Usage, Costs and Graphs


This is the main screen of the application and shows a summary of your readings, your usage and your costs for the period selected at the bottom of the screen (i.e. per day, week, month, quarter or year).
The “Readings” row shows when your most recent reading was added, and the usage and cost since your previous reading. To view, edit or export your actual readings, select the row itself.
The “Current” row shows your current usage/cost (the last point on the graph), as well as the average. You can choose to use annual or graph averages in the settings. If you have more than 12 months of readings, the figures for last year are shown instead. To see how the current usage and costs are calculated, select the row itself.
The “Delta” row shows the difference between your current and average values, and the arrows show whether you are above or below average. If you have more than 12 months of readings, the comparison is done against the figures for last year.
The graphs show usage and cost for the selected (calendar) period. They are shown as bar charts initially, but once the number of points gets too large, they switch to line graphs. On the iPad, graphs are shown for both usage and costs, but on other devices, simply double tap on the graph to switch between the two. You can also tap and hold the graph to display actual values at different points in time. If you have 2 or more years of readings, the previous year is shown in white, to make it easy to compare. A dashed line is used to show the average.
If you have multiple meters, you can quickly switch between them by scrolling/swiping to the left and right. Alternatively you can use the arrows icon at the top left to select and jump straight to a specific meter (useful if you have a large number of meters).
To add a new set of readings select the + button at the top right.
The power switch icon at the bottom left shows annual usage and costs for gas and electricity meters only (requires multiple readings).
The gears icon at the bottom right lets you configure a meter’s settings and rates, change application settings and manage your backups.
Adding Readings
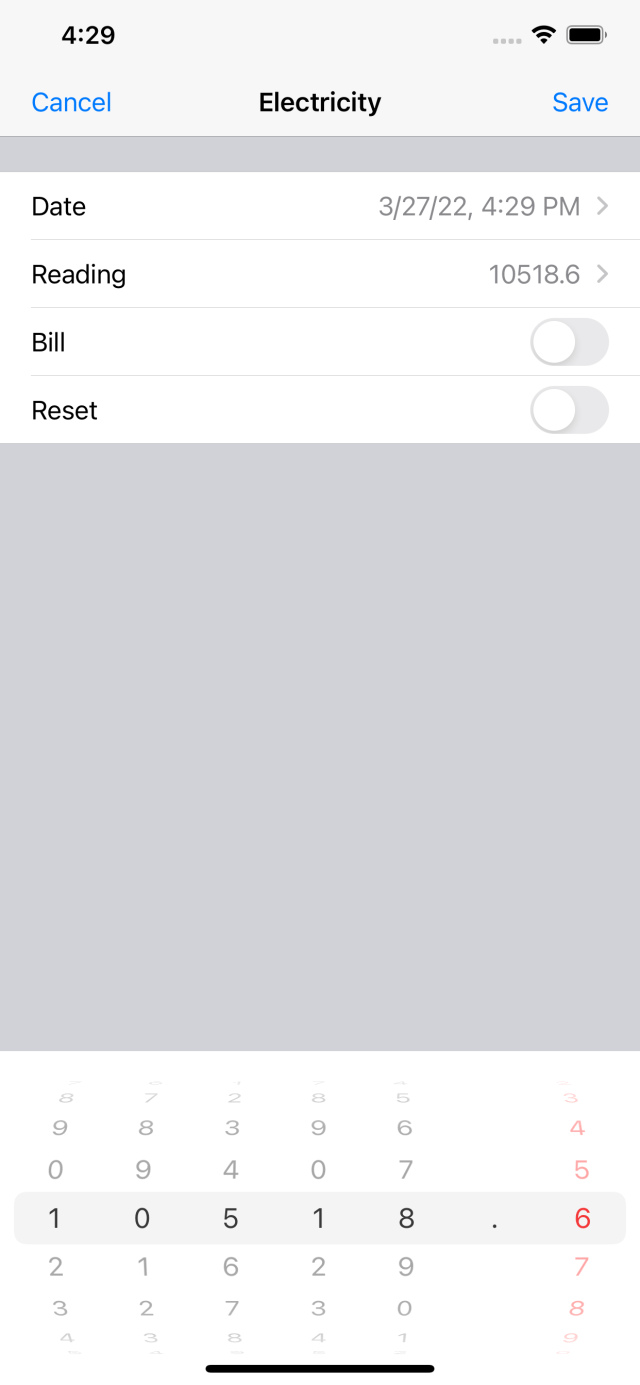
Readings are added by selecting the + button.
The date and time defaults to the current date and time, and the reading defaults to the last value entered for the selected meter. Selecting the “Date” row multiple times switches the display between date/time and date/year, the later being useful if you want to enter historical readings from earlier years.
The “Readings” row lets you enter each of your readings (one for all day rates, two for day and night … etc). These need to be added one at a time before saving.
The “Bill” switch lets you associate specific readings with your actual bills (note, it doesn’t submit your readings for you!)
The “Reset” switch is used to reset your readings, useful if you get a replacement meter (Power User upgrade required). Just take a final reading on your old meter (and save), then add an initial reading on your new meter (often 0), turning on the reset switch. The app will then ignore the difference between these two readings.
Once you have entered a date and reading(s), select Save. This then gives an option to advance to the next meter, letting you quickly enter all of your meters in one go.
Importing Readings
If you have a record of previous readings you have made, perhaps in a spreadsheet, you can import these as a CSV file. This needs to have one row per set of readings with NO header row. There should be exactly five columns as follows:
- meter name – this must match the exact name of a meter you have already created in the app (e.g. Electricity).
- date – this needs to be in the format dd/mm/yyyy hh:mm:ss. You can leave out the :ss, or simply use dd/mm/yyyy if you like, as long as all rows in the CSV file are the same
- reading 1, e.g. 12345.6
- reading 2 – if your meter has multiple readings, enter your second reading, otherwise set this to 0
- reading 3 – if your meter has multiple readings, enter your third reading, otherwise set this to 0
A sample row might read …
Electricity,31/12/2010 12:34:56,12345.6,0,0
Note, if your region uses a comma as your decimal separator, the readings need to be included in quotes, e.g. “12345,6”.
Once you have a CSV file in the right format, use any of the importing/restoring backup options (see below) to get the file onto your device. Then select it and choose to open it in Meter Readings.
Readings and Bills


The readings screen shows a table containing the date and time, usage for each meter reading, as well as an overall usage and cost, including discounts and fixed charges.
Individual readings can be edited (by selecting them) or deleted by selecting the Edit button, the red – (minus) button then Delete.
To add or edit notes per reading, select the blue buttons. Readings with notes are shown with a yellow background.
The period options at the bottom let you view the difference between each reading (the delta symbol), or their daily, weekly, monthly, quarterly or yearly equivalents.
The icon at the bottom left lets you view your usage and costs since your last bill or give an estimate of your next bill. You can also choose to view readings between bills only, to check what you are being charged. Readings submitted as bills are shown with a blue date.
Usage and cost since your last bill simply compares the last “bill” reading with the most recent reading.
To estimate your next bill you need to have at least two “bill” readings. This lets the application work out the period between bills, and therefore when your next bill is expected. Usage is taken up to the point of the most recent reading, and then usage to your next bill date is added using your current level of consumption.
Exporting Readings
The icon at the bottom right (of the readings screen) lets you export readings as CSV file, for easy import into a spreadsheet.
Other (Application) Settings
Use the gears icon at the bottom right of the main screen to configure various application settings.
There are a number of different options for backing up and sharing your data. Full details in the next section.
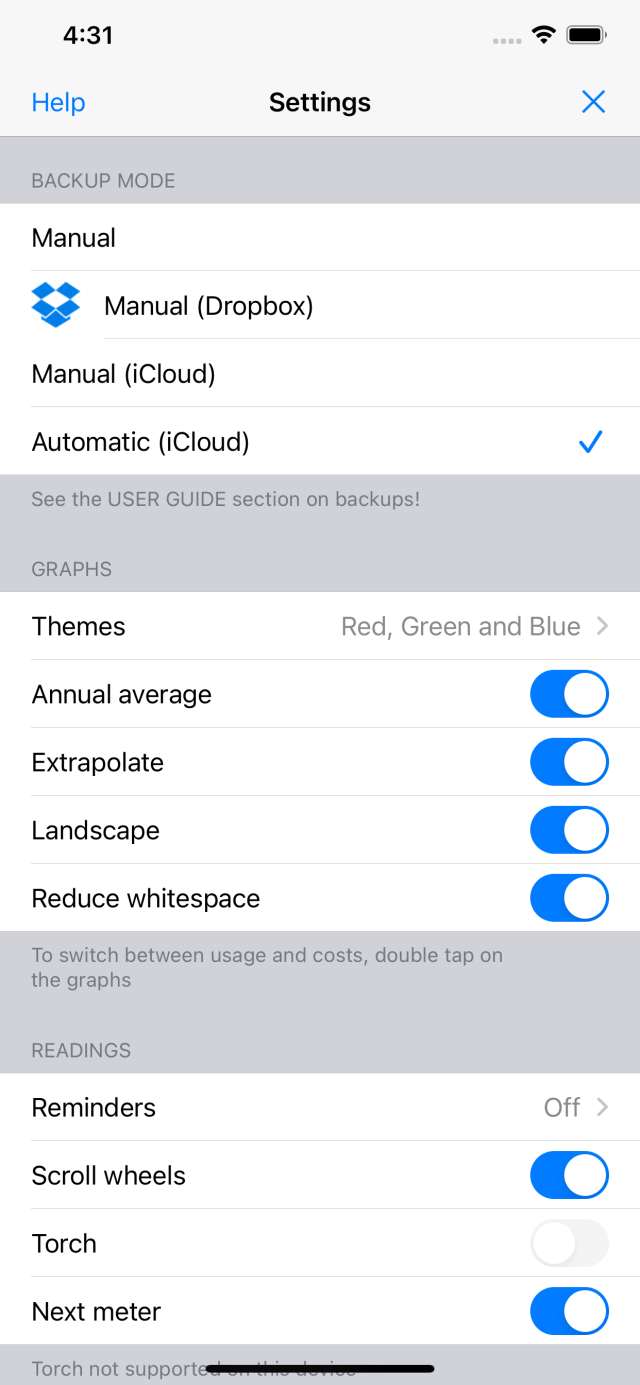
Under graphs, you can choose a number of themes. The black, red, green and blue options use a single colour for the line and bar graphs, whereas the default “Red, Green and Blue” option uses blue for the line graphs, and red and green for the bar charts, depending on how the values compare to the average or last years figures (if available).
Annual average will use the average of your readings over the previous 12 months, to take seasonal variations into account. Turning this off will use the average over the graph period (e.g. 3 or 6 months).
Extrapolate will extend the end points of the graph by estimating what the usage would be right up to the end of the selected period (e.g. month or year).
Landscape mode can be disabled to prevent screen rotation (iPhone and iPod Touch only).
Reduce whitespace will start line graphs at the actual minimum rather than zero, making more efficient use of the space available.
Under readings, you can set a daily, weekly or monthly reminder where a notification will be posted to your screen when it is time to read your meters.
Scroll wheel entry lets you add/edit your readings using a scroll wheel rather than a keyboard (always supported in landscape mode on the iPad).
If your device has a torch/flashlight, you can use this when entering new readings, very useful if your meters are in a dark cupboard!
Next meter is used when adding new readings, to prompt you to move on to the next meter, i.e. Save, Next, Save, Next, … etc. If you prefer to enter each reading separately, you can turn this off.
Other settings include a default email address, used when exporting backups or readings in CSV format. This speeds up the export process as you won’t have to manually enter an address each time.
The “Power user” upgrade is a ONE-TIME purchase that adds support for the following additional features: extra meter types, rate/tariff changes, replacement meters (reset) and automatic backups to iCloud.
The “Pro user” upgrade is a ONE-TIME purchase that removes the restriction on the number of meters supported, and is intended for landlords, businesses and professional users.
If needed, purchases can be restored, e.g. if these were made on another device.
Backups

Use the gear icon and choose Backups to make and/or restore backups of your data.
The backups feature is a more flexible and reliable way of protecting your data than using a full device backup (e.g. to iCloud). Should the worst happen, it is very easy to import and restore (a backup).
To make a new (manual) backup, go to the backups screen, select Backup Now and an entry will be added to the list of files displayed. Backups are shown in reverse date order (most recent first), and the date and time they were made is included in their names …
mrYYYYMMDD@HHMMSS.bak
To delete a backup, swipe across it from right to left and select Delete.
Exporting Backups
A backup on a single device won’t protect you fully, e.g. you might lose your device or need to restore it to factory settings (e.g. if there is a hardware fault). Also if you delete the app (possibly by accident), all of your backup files will be deleted too. It is therefore very important to export your backups off your device.
On the settings screen, you can choose to have new manual backups copied to either Dropbox or iCloud. Turn this on and all new backups will be exported automatically.
Any backups shown in red are probably not on Dropbox/iCloud. To manually copy a backup, select it and choose the Copy option.
If a backup file is on your device, you can select and export it by AirDrop (to a nearby device) or by Email.
Automatic Backups
By far the easiest way of exporting is to use automatic backups (Power User upgrade required). Your meters, rates and readings are monitored and if there are changes, a new backup is made and copied to iCloud when you close the app.
Note that the automatic backups feature also removes older backups, only keeping the 5 most recent.
Importing/Restoring Backups
If the file is already there in the app, go to the backups screen, select it and choose the Restore option.
If it is only on Dropbox or iCloud, choose the same backup setting (i.e. Dropbox or iCloud), go to the backups screen and the file should be visible. Select the backup to restore it.
If it is in an email, select the attachment and open it in Meter Readings.
If it is on another device, use the Export by Airdrop option (on the other device).
Multiple Devices
To use the app on multiple devices, I recommend using automatic backups on your main device only. Then always use that device to edit your rates or add readings.
If you then configure other devices to use Manual (iCloud) backups, they will see any new backups from your main device and prompt you to restore them.
While it is possible to use automatic backups on all devices and to add readings from anywhere, you have to be really careful. iCloud can be very slow to update and you might not be editing your latest data.
